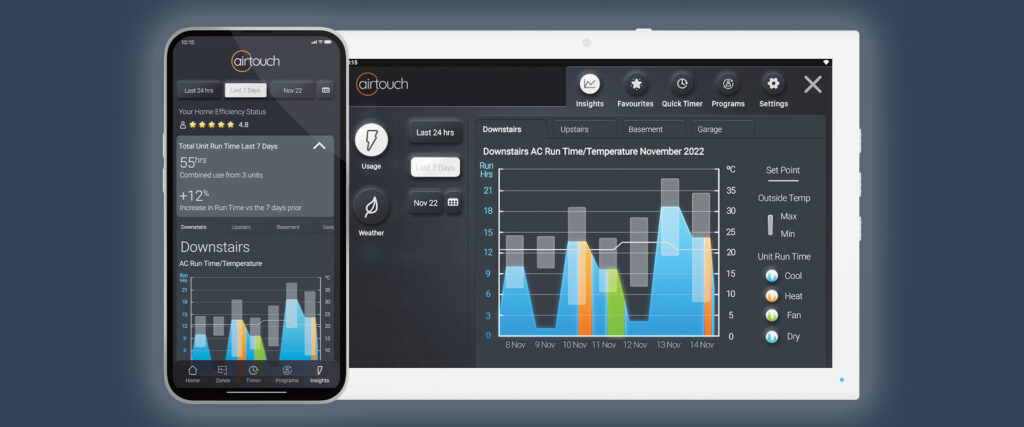
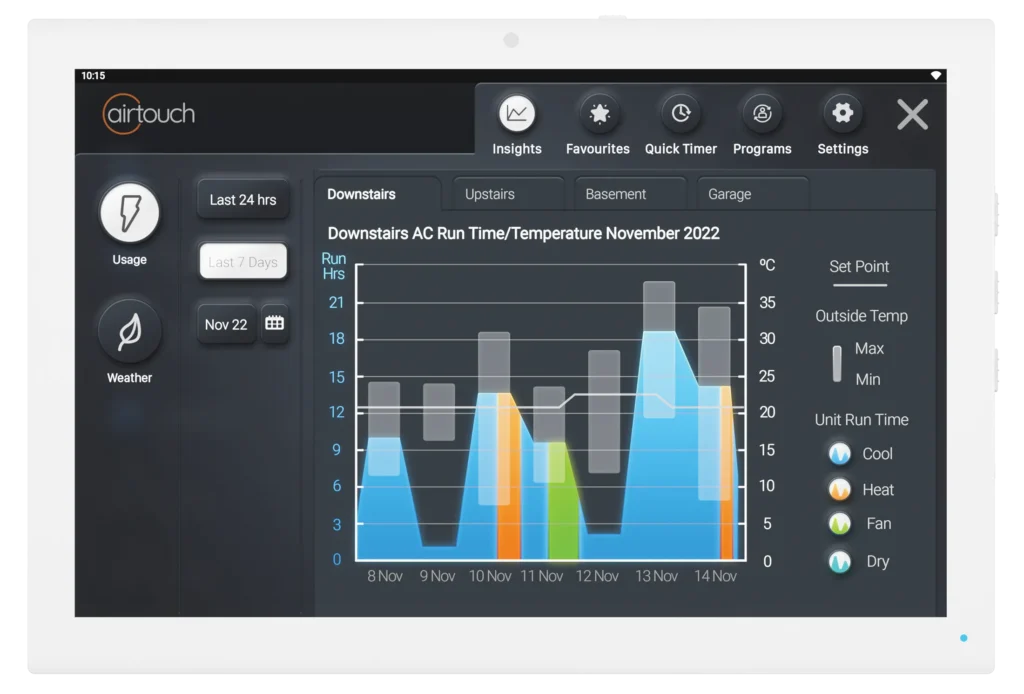
AirTouch 5 empowers homeowners to make better decisions about their air conditioning usage by providing intuitive graphs that compare AC runtime, temperature settings, and operating mode with local weather conditions.
This feature helps users understand if their AC settings are appropriate for the outside temperature, encouraging smarter energy consumption and promoting sustainable living.
Key Metrics Tracked by AirTouch 5
-
Temperature Settings: View the temperatures your AC is set to and identify inconsistencies or overuse.
-
Runtime: Monitor how long your system has been operating to spot usage trends.
-
Mode of Operation: Clearly see when your system was set to heating, cooling, or fan mode.
-
Local Weather Comparison: A standout feature that shows how your AC usage compares to real outdoor temperatures, helping you assess whether the system was used unnecessarily when conditions were mild.
Usage Trends Over Time
AirTouch 5 provides flexible views to help you analyze and optimise energy use over various periods:
-
24-Hour View: Get a snapshot of daily usage patterns.
-
Weekly Review: Identify peak usage days and irregular trends.
-
Monthly Overview: Track long-term habits and adjust settings accordingly.
Why It Matters: Sustainable and Informed Living
AirTouch 5 isn't just about data, it’s about empowering users to act on insights:
-
Identify overuse or unnecessary operation.
-
Adjust set points to match personal comfort and outside conditions.
-
Reduce energy consumption without compromising comfort.
By aligning your climate control with local weather patterns, you can lower energy bills and make more environmentally conscious choices.
![]()